WELCOME TO THE NEW WORLDCOM CONFIDENCE INDEX PARTNER PORTAL
WE RECOMMEND YOU REVIEW THESE INSTRUCTIONS before you start using the dashboard and the data. It will help you understand what data is available to your agency – specific country and region data – and how to use it.
PARTNER PORTAL – a private page only accessed by partners
- You can see global and local results
- This will enable you to build your own local story for your country or region
- This will enable you to create your own insight that is tailored to your agency and its area of focus
- You can download the data in a range of formats from Images to PPT to PDF and Excel
We recommend that you download the data you need each month so you can make comparisons between months. The live data will only show the current month’s data.
To see the latest Global WCI results and the press release – please follow this LINK or scroll below.
The official new logo for the WCI can be downloaded here!
TO ACCESS THE DASHBOARD WITH THE COUNTRY, REGIONAL AND GLOBAL DATA:
- CLICK ON THIS LINK
- LOG IN WITH THE FOLLOWING DETAILS:
- USERNAME: WorldcomPartner
- PASSWORD: WCI123
QUICK ACCESS:
- Once Logged In – to access the Global Monthly results – click this LINK
- Once Logged In – to access your Local and Regional Monthly results – click this LINK
- By clicking on both links you will be able to toggle between the Global view and the Region/Country view.
Useful Definitions:
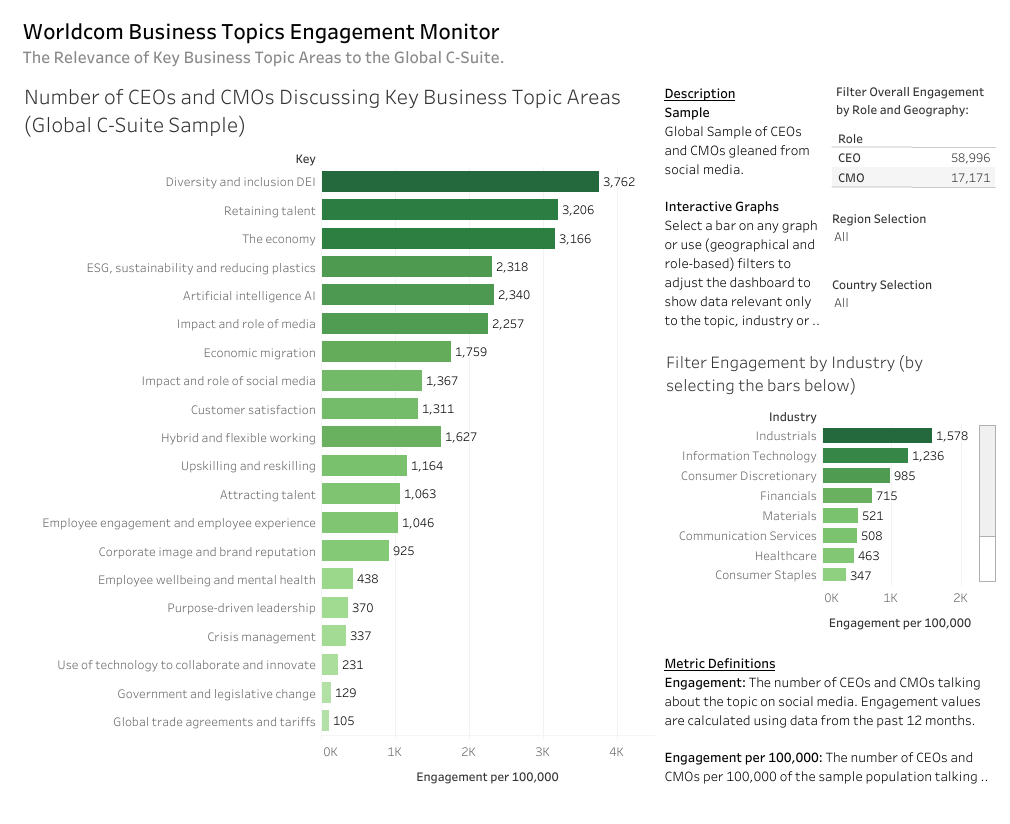
- Engagement – The number of CEOs and CMOs talking about the topics on social media. Engagement values are calculated by using data from the last 12 months
- Engagement per 100,000 – The number of CEOs and CMOs per 100,000 of the sample population talking about the topic on social media. The data is presented in this format so that comparisons can be made between the various countries. The ‘raw’ engagement levels are higher. For example, in October the ‘raw’ number of execs engaged with DEI was 41,746 but the ‘normalised engagement per 100,000 was 3,762
- Confidence – Level of confidence change is calculated through natural language processing techniques that analyse the sample’s conversations per topic over time and comparatively against each of the other key business topics. The numbers you see on charts are the change in confidence levels. For example, the confidence in use of technology has increased by 3.12% since the last time we measured confidence.
- Active Sample – The research uses an Active sample for the calculations. Active Sample means the amount of people from our sample that were on the internet during the time interval of the study
- Population – Usually, the population size is the census population of the region/country of any sample. However, for this project (since the population of global c-suite is unknown), we take the total number of executives that the data source we used to create this sample provided as the population size – in this case 554,882